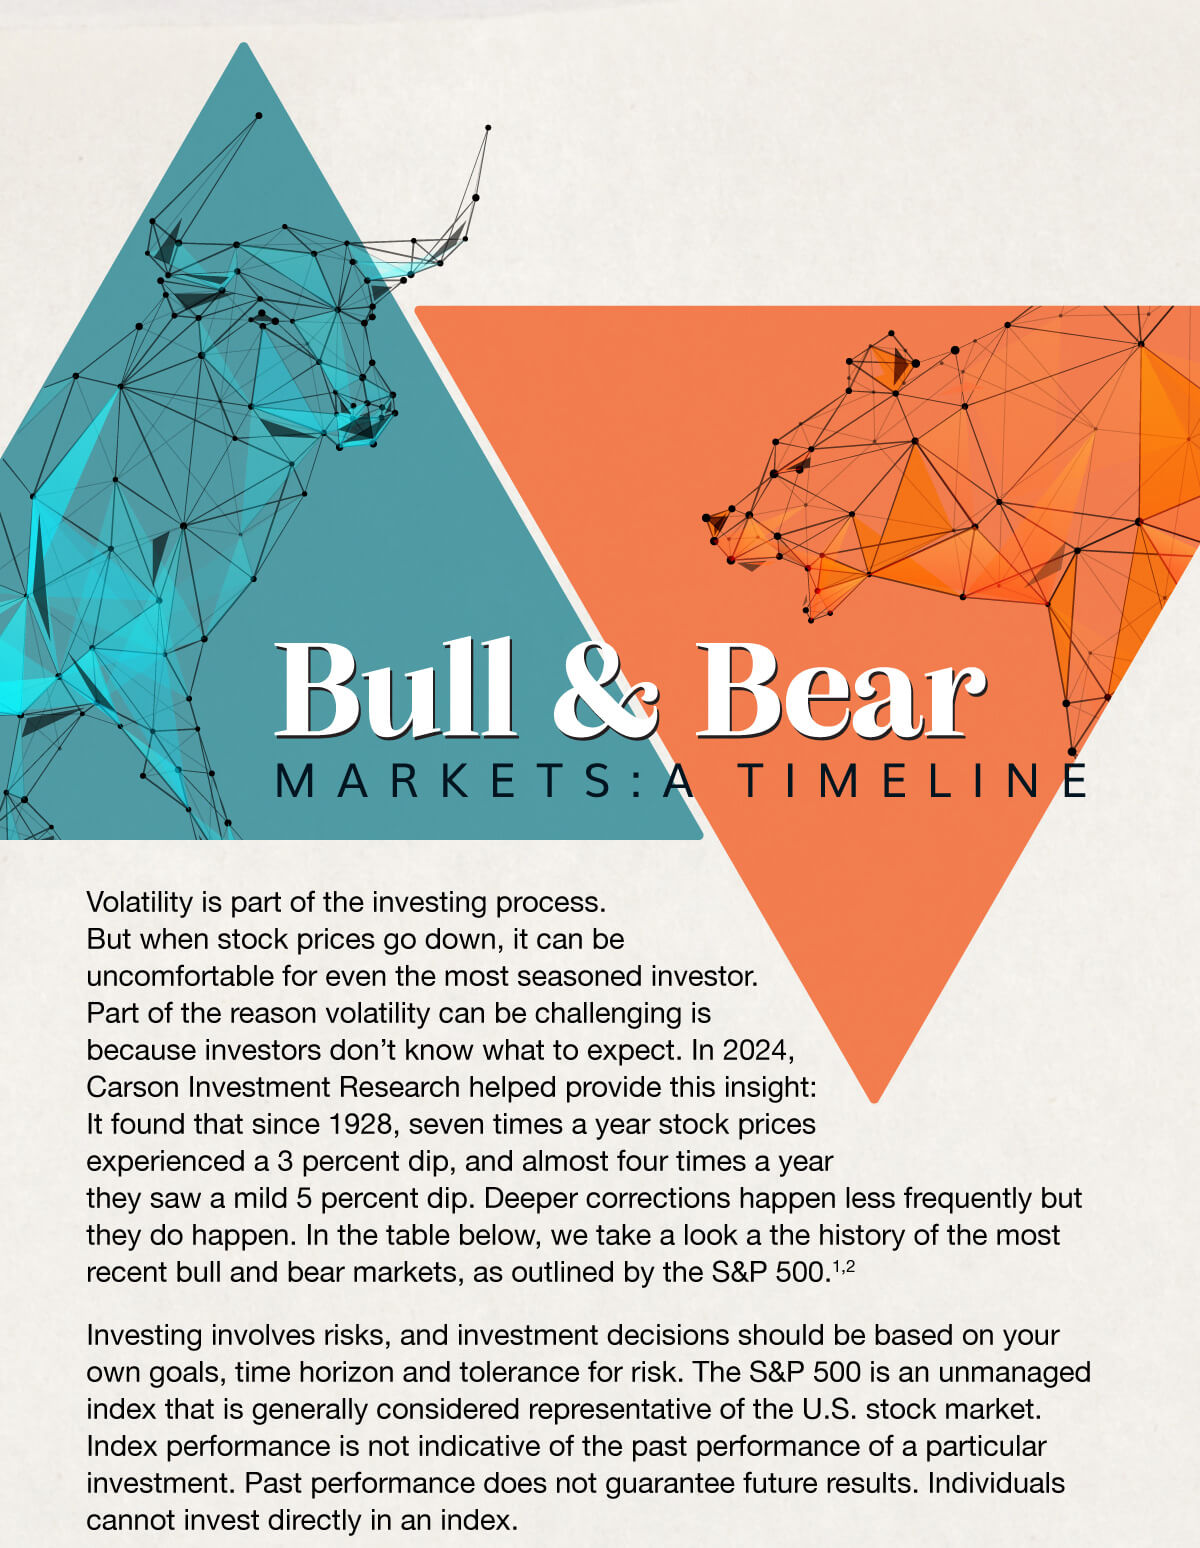
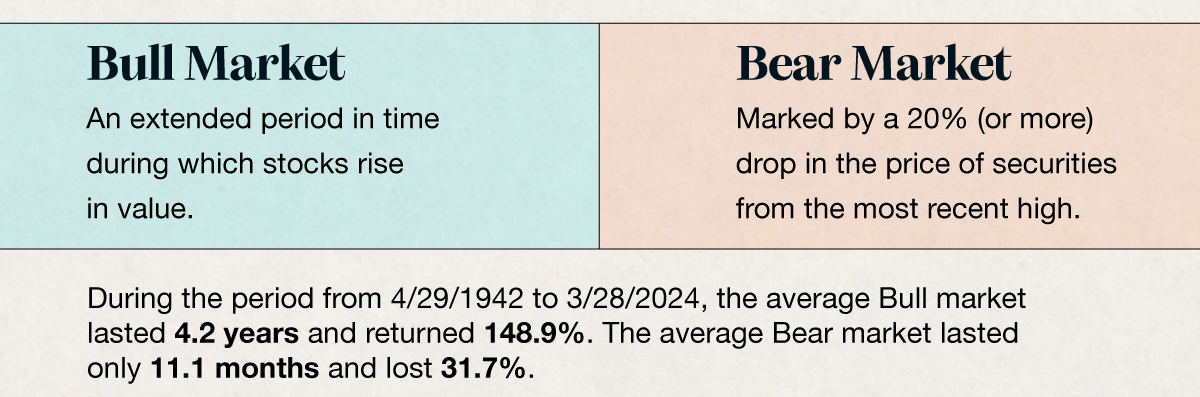
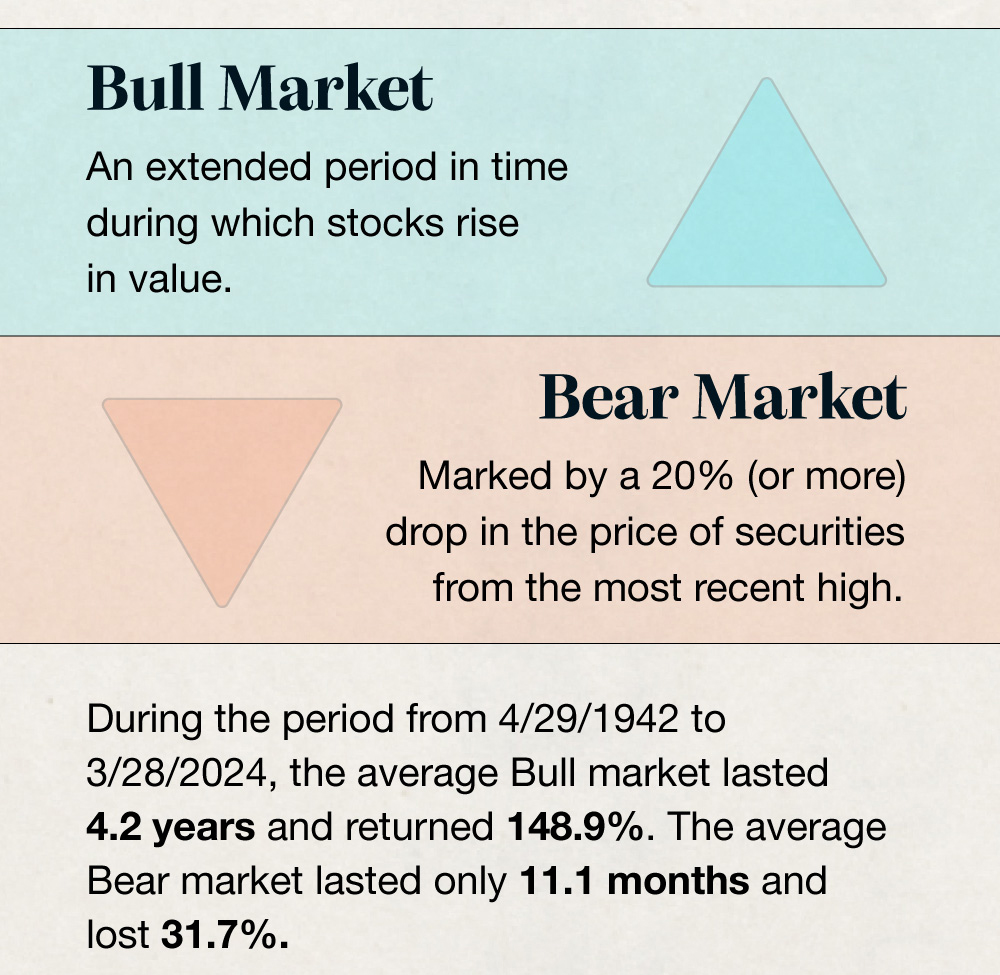
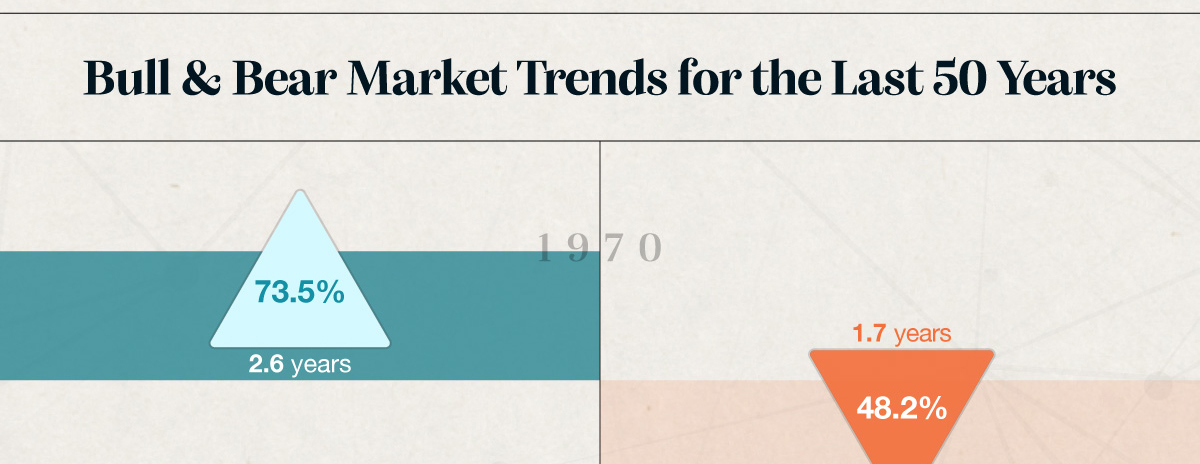
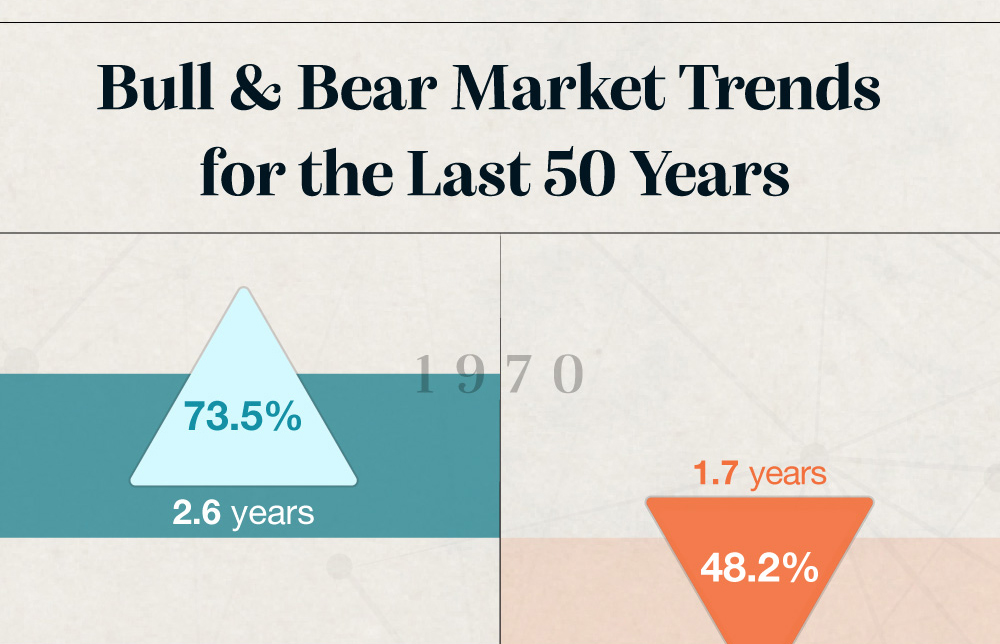
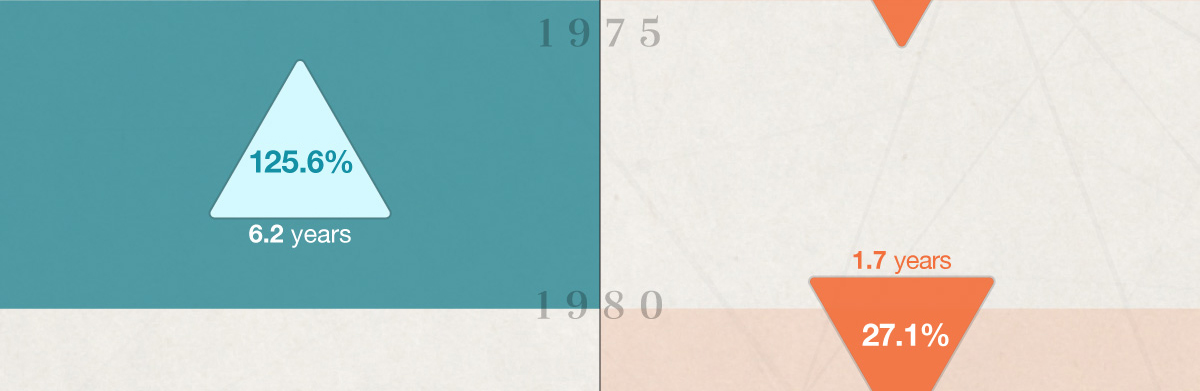
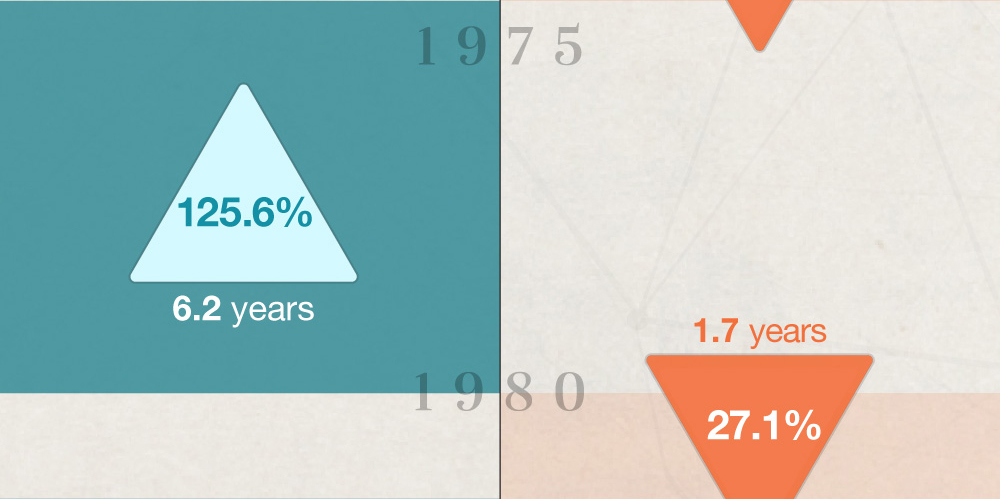
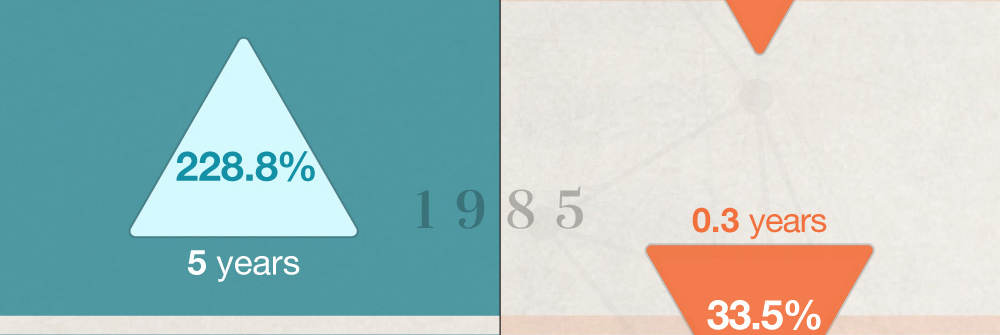
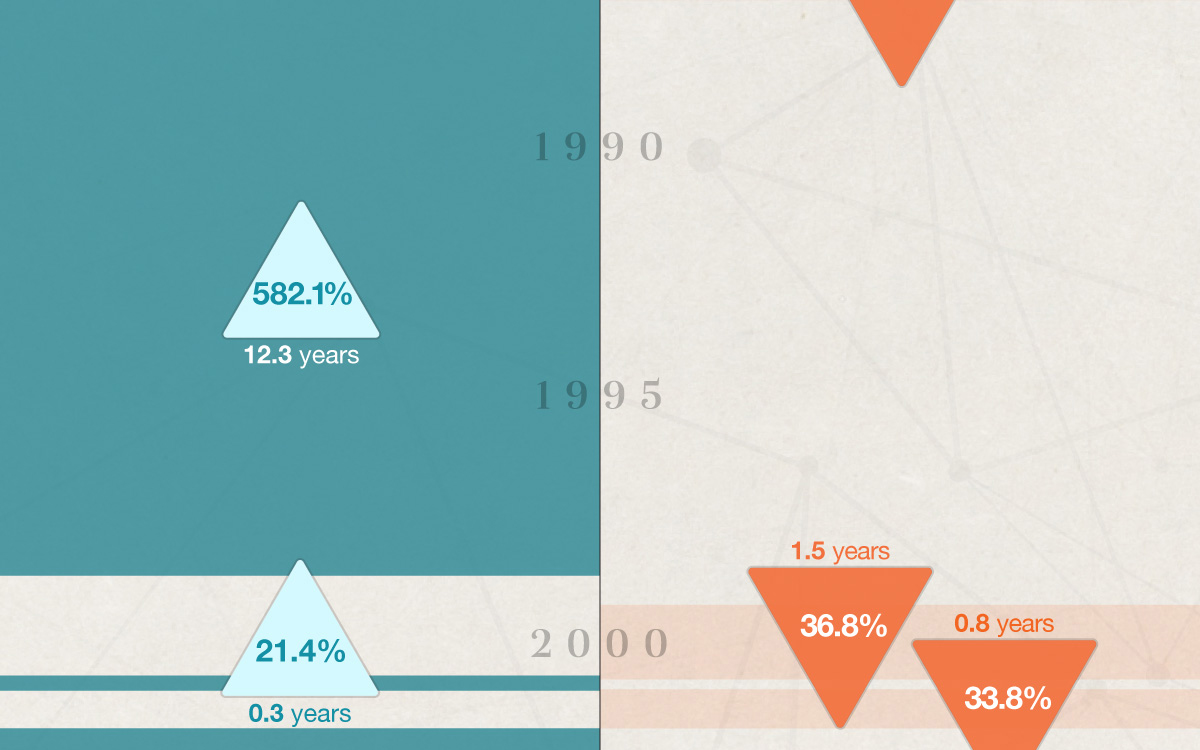
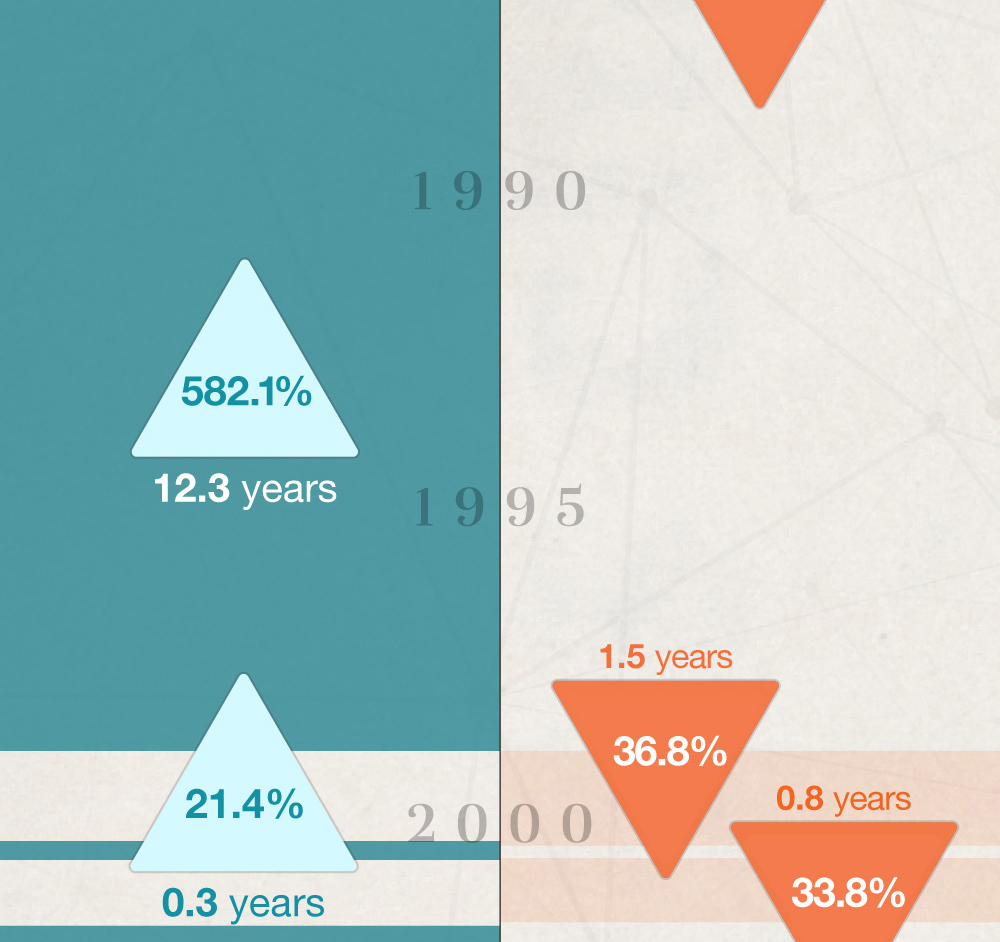
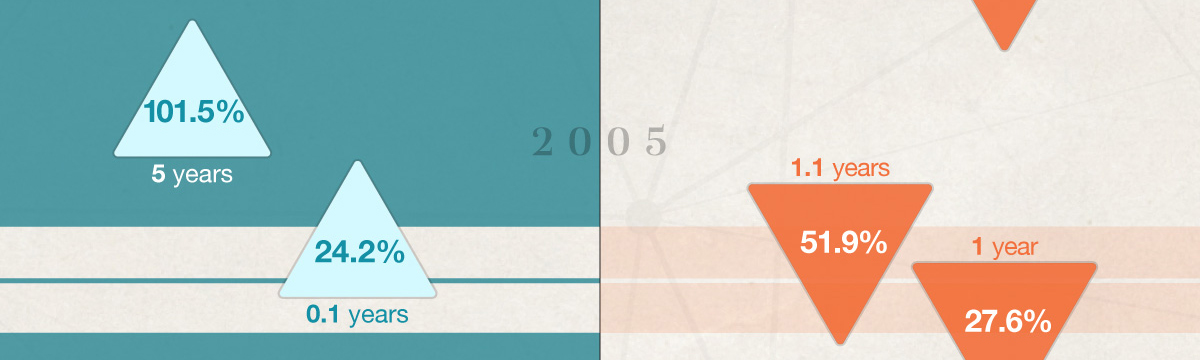
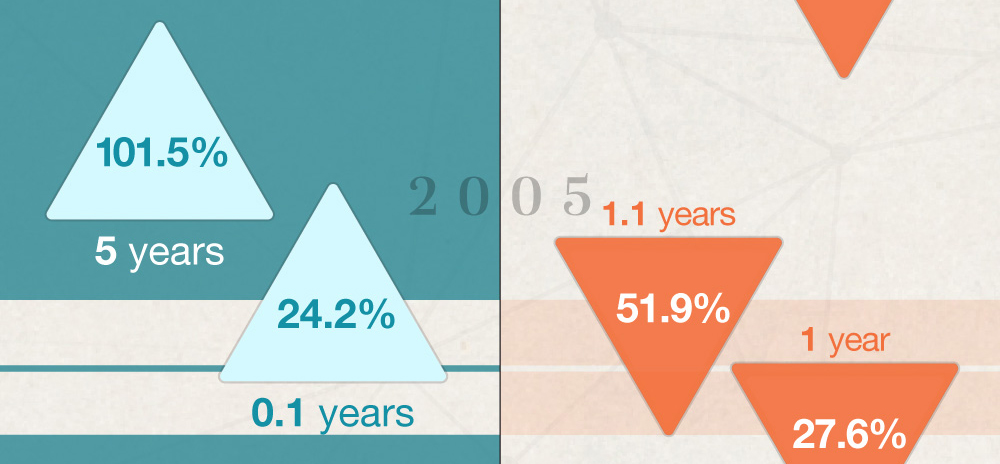
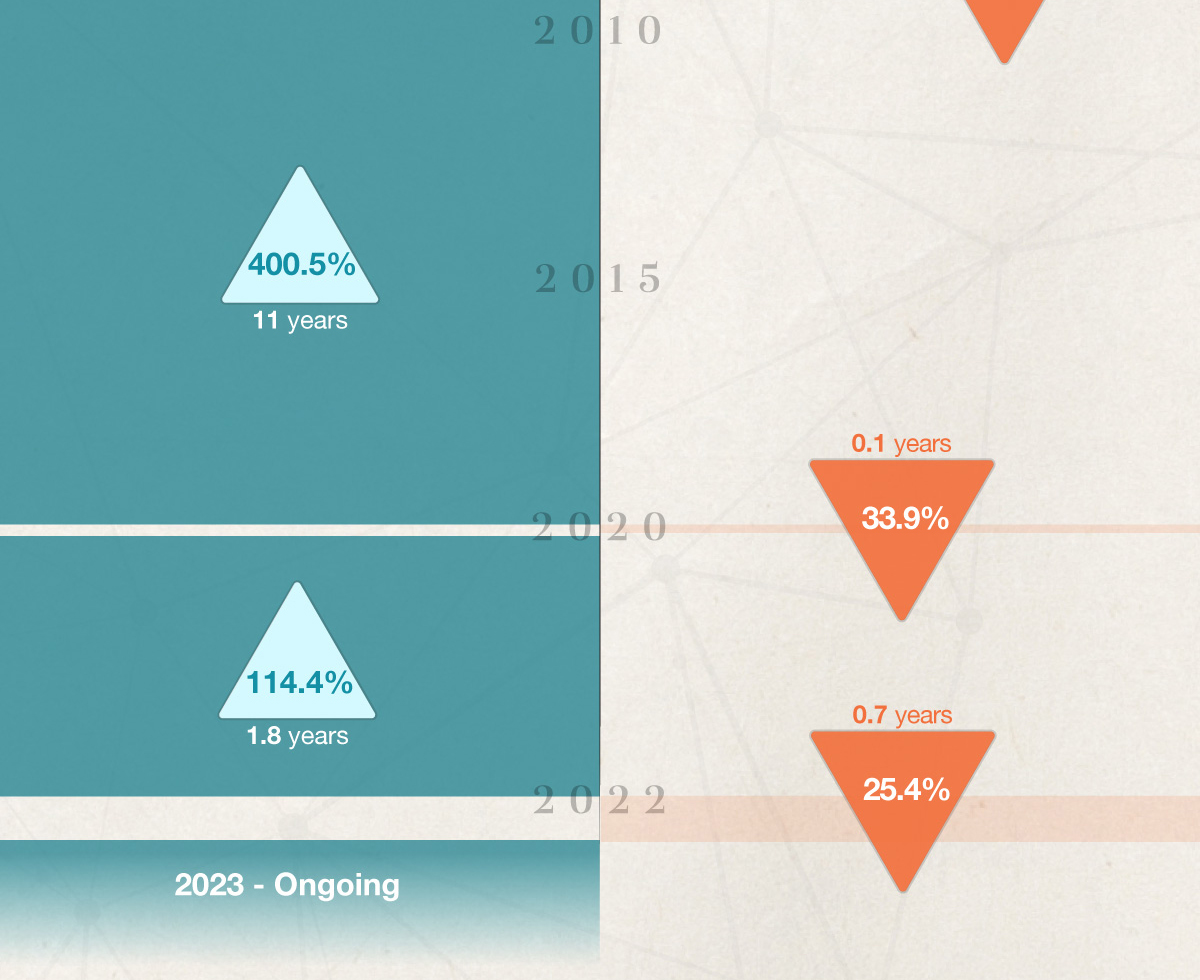
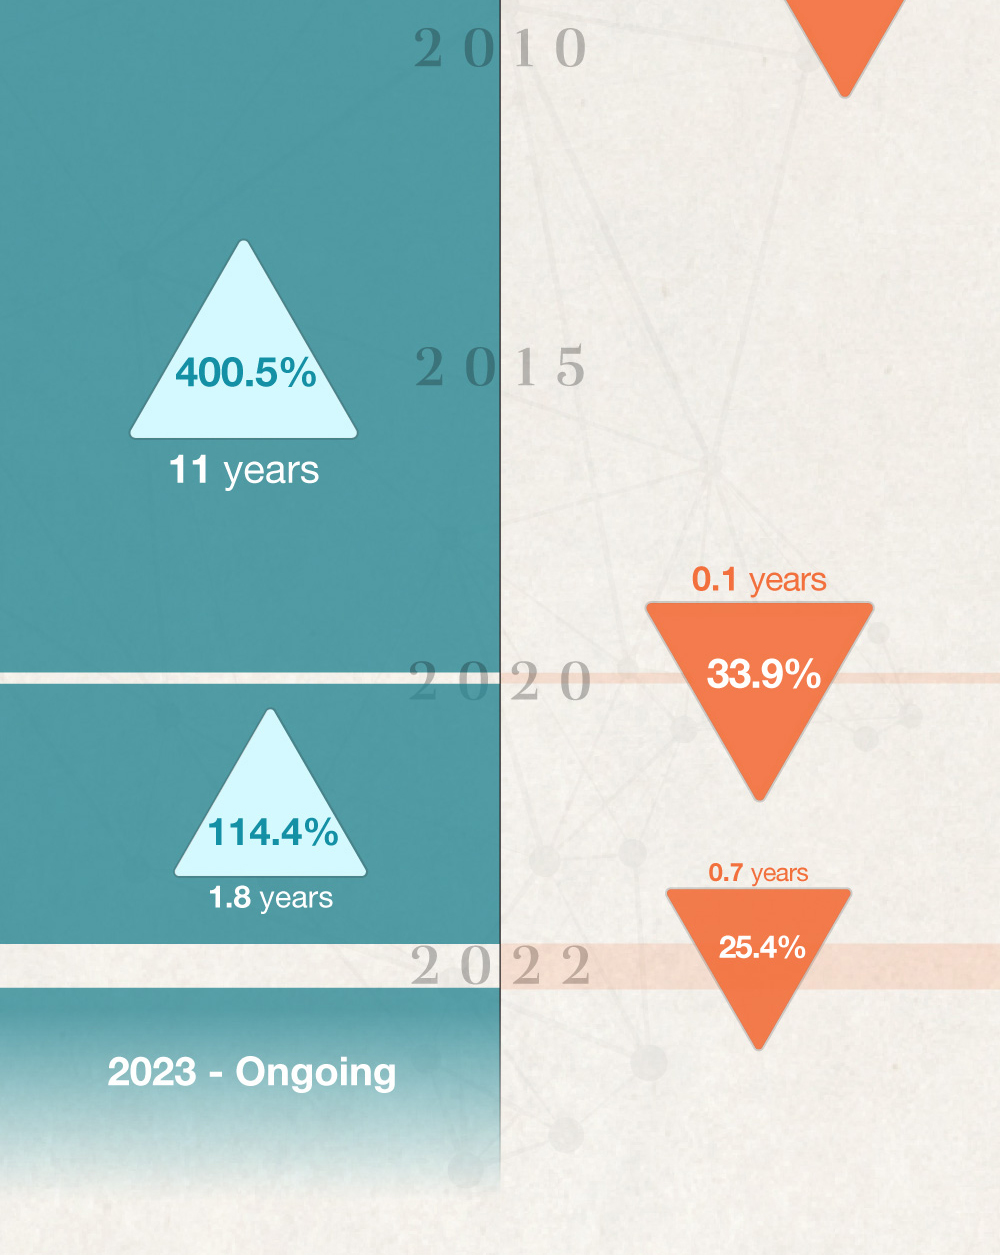
Bull & Bear Markets: A Timeline


You make decisions for your portfolio, but how much do you really know about the products you buy? Try this quiz

This short video helps explain why markets can be as unpredictable as the weather.

Having your identity stolen may result in financial loss plus the cost of trying to restore your good name.
We are committed to providing the ultimate client experience by attentively listening and comprehending what is most important to you. This comprehension allows us to align your account values with your core values and develop strategies to help you pass them on to future generations and live the life you desire.
![]() 2111 E Highland Ave
2111 E Highland Ave
Suite B420
Phoenix, AZ 85016
![]() 480-716-6100 MAIN/FAX
480-716-6100 MAIN/FAX
855-716-6100 TOLL FREE